Gather your own accessibility data
All ingredients to gain insight into the use of accessibility features in your own app.

Data on the use of accessibility features in your own app provides more focus on accessibility. It gives insight into the needs of your users and helps make targeted choices. Your own dataset can help you in the following ways.
Persuade and apply focus on accessibility. Data makes it clear that there is a need and it highlights the need to support digital accessibility. It helps in making a business case and convincing decision-makers.
Understanding your users' needs. The data shows you exactly which functions are used and how much. This gives you the chance to determine which steps to take to best serve the largest possible share of your users.
Help with prioritisation. It gives you insight into which changes will have the most impact. This allows you to decide what to pick up first and what to pick up next.
More detailed insights. By collecting the data over a longer period of time, you get increasingly detailed insights into the use of features for accessibility on your users' phones. For example, at one client we initially saw no use of a screen reader. But after a few months, this number had risen to several hundred.
Do it yourself? Here are the ingredients.
To collect your own data, you need the following:
A piece of code in the app to retrieve the data.
A place where you can store the data.
A way to share the collected data.
To make it easy for you to do the same, here we share how we collected the data for this website. N.B. All code is open source and free for you to use. All we ask is that you refer to its original creator, namely Q42.
Step 1. Collecting data
To do this, we have developed a library (a small piece of software) that is added to their apps in consultation with our customers. This library checks which accessibility options users have activated on their phone when the app is launched. Querying this data is something every app does. This is because it is necessary to know which settings on the phone the app needs to support. Think dark mode, for example. Our piece of code also requests this data. We have developed two libraries. One for iOS and one for Android. These are open source and free to use for everyone.
Q42Stats library for iOS
Collect stats for Q42 internal usage, shared accross multiple iOS projects.
Q42Stats library for iOS on GitHubQ42Stats library for Android
Collect stats for Q42 internal usage, shared accross multiple Android projects.
Q42Stats library for Android on GitHubStep 2. Building a pipeline
To process the data, we set up what we call a data pipeline. This consists of several parts, namely: for each app, we use an instance of Firestore. In this, the data from the apps is collected for 24 hours. Every 24 hours, this data is processed to BigQuery. Then the data is deleted in Firestore. This is to keep costs as low as possible. In BigQuery, the data is merged with all historical data. The data is stripped of any duplicates and added to the already stored set. That's the simple explanation. Our pipeline is open source and more extensively documented on github.
Accessibility pipeline
This project facilitates the greater part of an initiative to gather information about usage of accessibility settings on mobile phones.
Accessibility data pipeline on GitHubStep 3. Giving insight
How you want to share the data next is, of course, entirely up to you. Sometimes a simple table with all the collected data is enough. We have chosen to share the data with our customers via Google's datastudio. We cannot share that data but we can give an example of what that looks like.
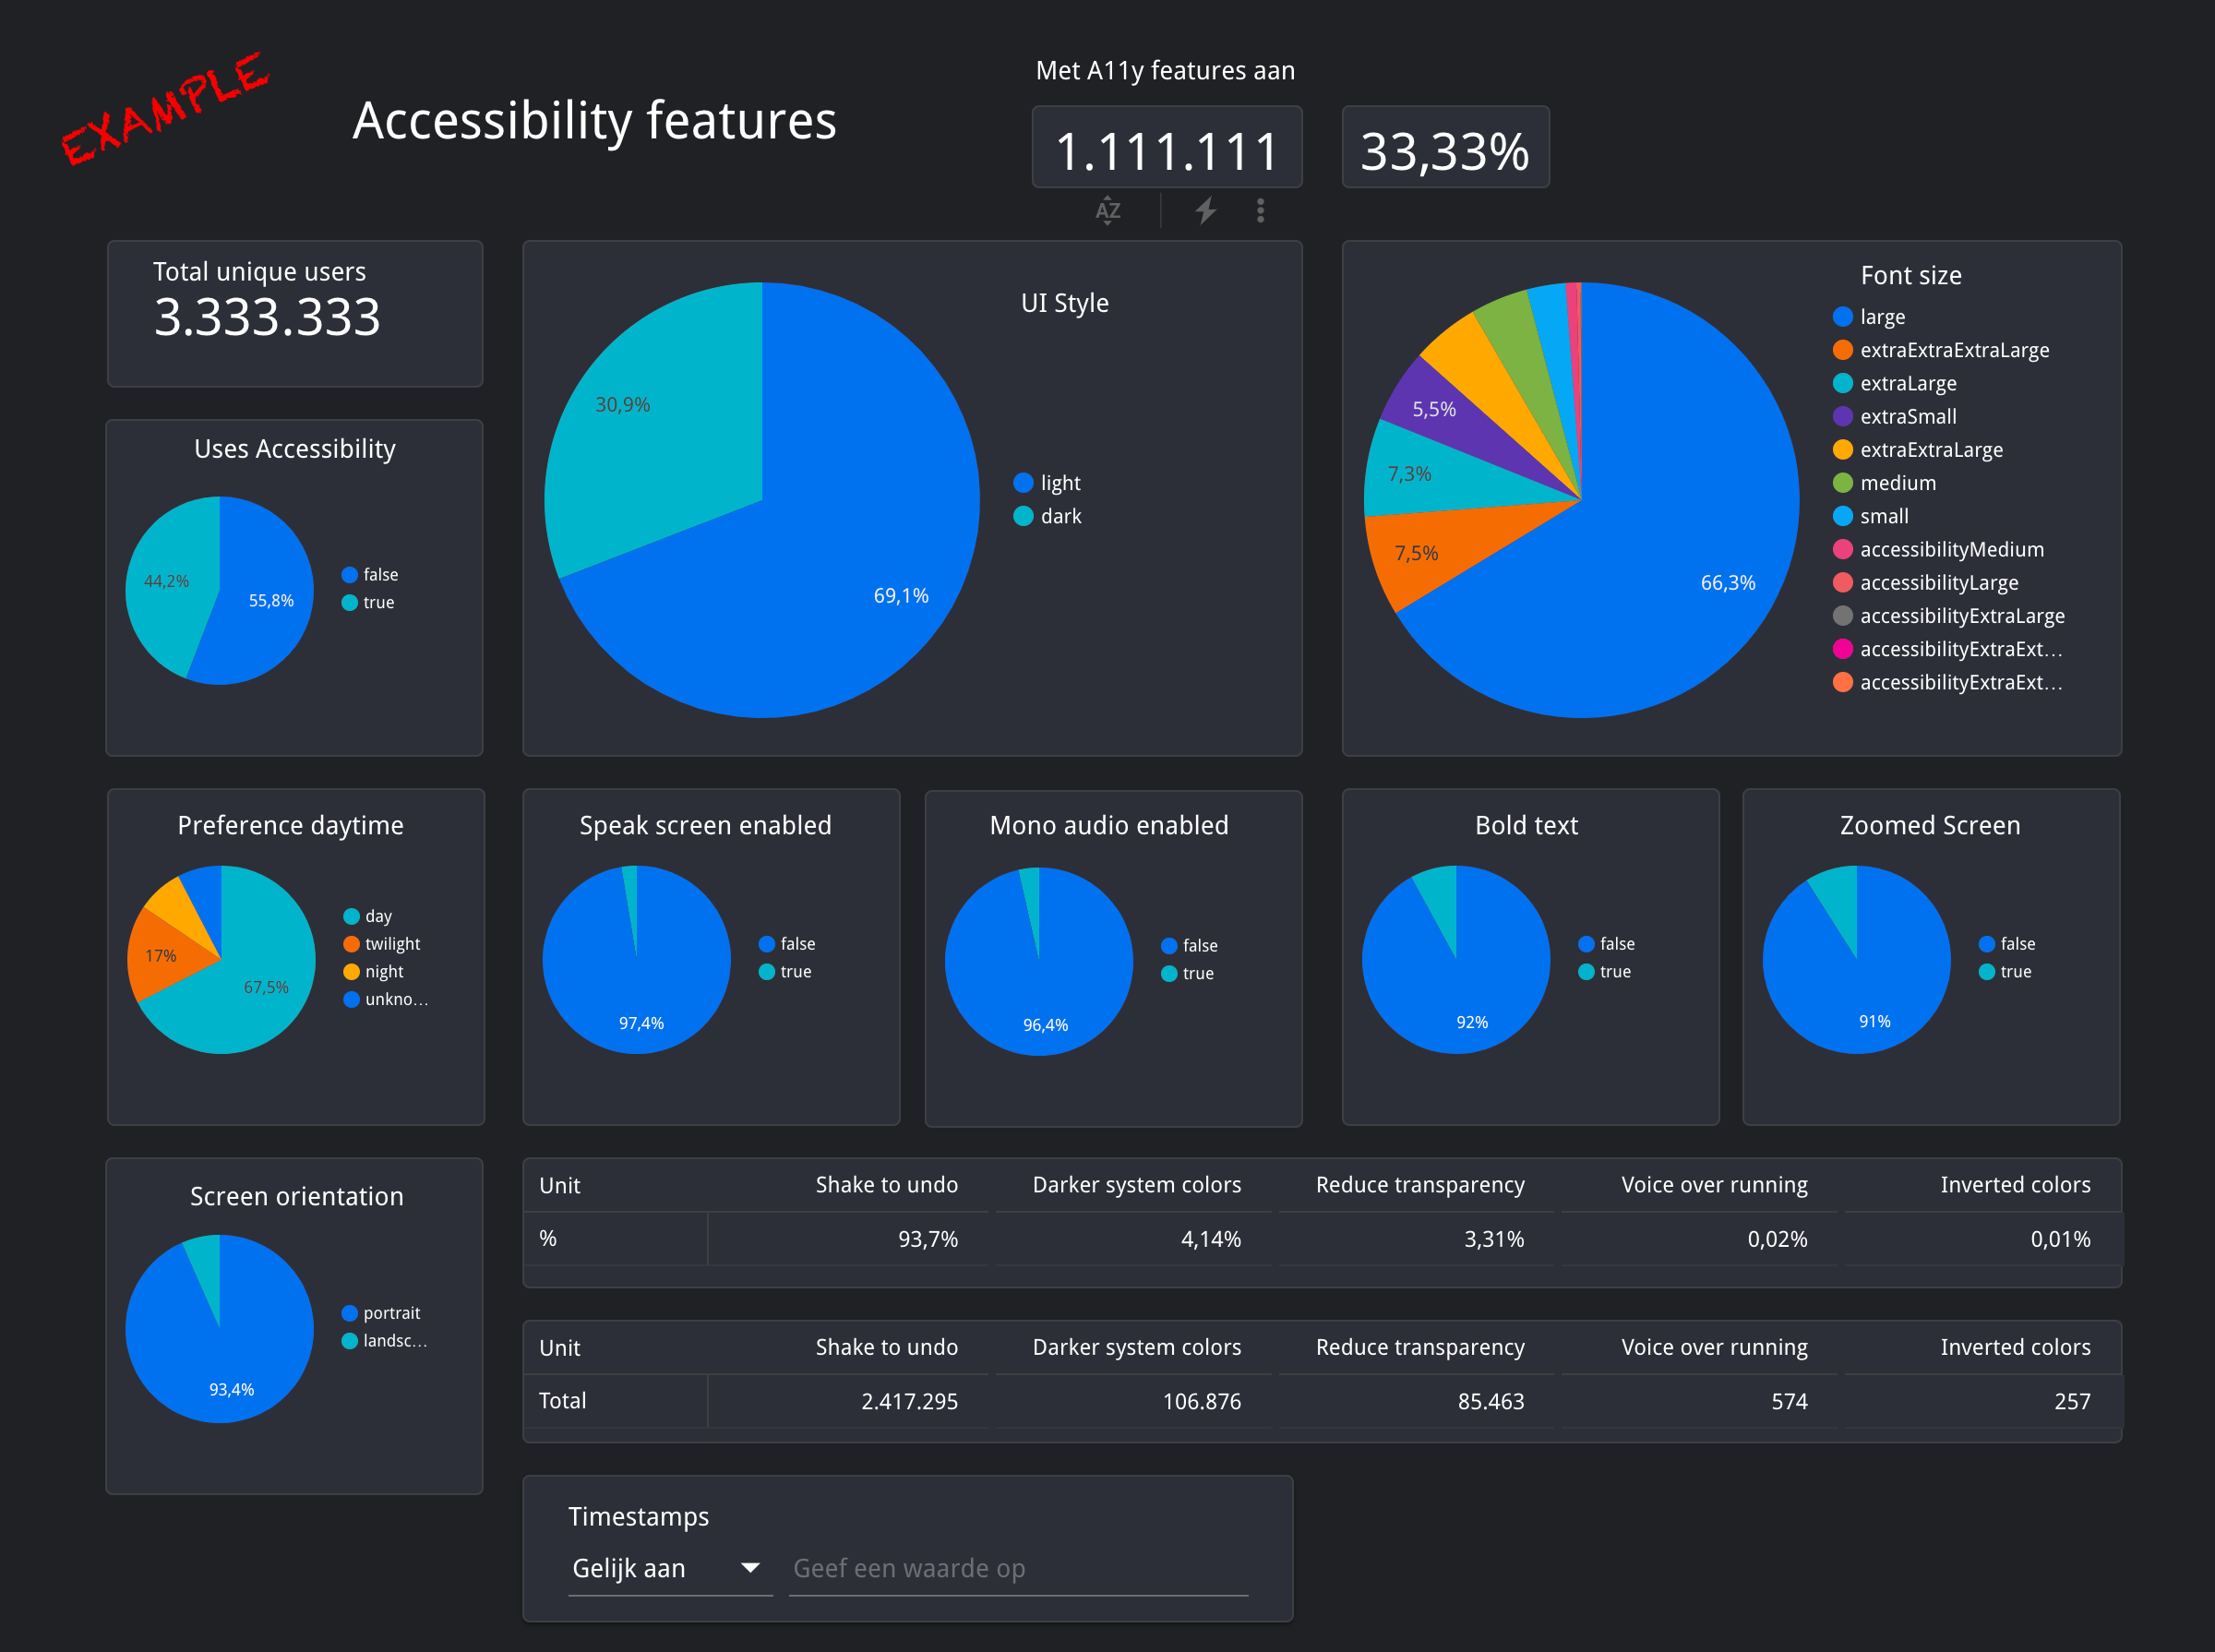
What we can share are the aggregated data of all these customers combined. That's the data you see on this site.
Accessibility statistics
Almost half of all people with a mobile phone use accessibility features. Much more than you would expect. We researched the real use of all these features.
All accessibility statsAny questions?
With this documentation and code, you should be able to start your own collection of accessibility data. Is there anything missing? Is something not quite clear? Then contact johan@q42.nl or let us know in Appt's Slack channel.